


Wide Events in C#: One Event per Request
One log entry instead of twenty
A checkout fails without a trace: Dozens of log lines take time but provide no context. The solution is wide events. Instead of logging code steps in fragments, bundle all relevant data into a single event per request. This is how you achieve true observability in C#.
The Case: A Checkout Fails Without a Trace
One Thursday afternoon, a ticket ends up in the queue:
“The customer reports that the checkout failed this afternoon. No order number is available. Can you look into this?”
What happens next is predictable. You open your logging tool, filter for the checkout service, and expand the time range to two hours, since “this afternoon” isn’t a specific time. Then you start reading. At some point, you’ll find this:

Four lines. All four are correct. Not a single one helps identify the problem.
The Problem: Why Four Valid Log Lines Are Useless
Which shopping cart was involved? What was in it? Was the customer part of the new pricing flow that was rolled out on Tuesday? Was this the first attempt or the fourth? What exactly did the payment gateway respond with when the error occurred?
The key point: The process knew all of this information. Every single piece of it was in memory and within the scope at the time each log line was generated. We just never asked for it. We logged what the code does, not what happens to the request. As a result, the interesting information is irretrievably lost. This is exactly where Wide Events come into play—and with them, a different understanding of observability.
Structured Logging Solves Only the Easier Half of the Problem
Anyone who works with .NET has probably already taken one of the recommended steps: using message templates instead of string interpolation:

And the data is then stored in a structured format using JSON in a file or another log sink. This makes OrderId a real field that can be used for filtering, rather than a substring where you have to hope it was written exactly as the colleague who implemented the line intended. That’s real progress and absolutely the right approach.
What matters, however, is what has has not changed. The format has improved, but the unit has not. The unit of logging is still a moment in the execution of the code: a line that fires when the control flow reaches it, and that only knows what is in scope at that exact moment. Twenty structured lines per request are still twenty fragments that must be manually pieced together in the event of a failure: in your head, under time pressure, in a codebase you last touched six months ago.
Added to this is a practical problem under heavy load: A service processes many requests simultaneously, causing their log entries to become jumbled chronologically. Entries from dozens of other transactions are then interspersed between “Request started” and “Payment failed.” While a request or trace ID generally makes the lines traceable, it requires that the ID be consistently included at every relevant point. Even then, you first have to identify the correct request, then filter by its ID, and finally reorder several fragments into the correct sequence.
What Are Wide Events in Modern Observability?
A wide event is a single, structured data record for each completed work unit—usually a request—that is not emitted until the end, when the overall result is determined. Instead of twenty scattered log lines, this creates a coherent, query-friendly unit: result, duration, involved dependencies, customer and business data—all in a single entry.
The idea isn't new: Under names such as Canonical Log Lines, Stripe, for example, has been describing them for years. Under the buzzword Observability 2.0, it has recently gained new momentum. The article Logging Sucks – Your Logs Are Lying To You by Boris Tane.
The core of the idea is to redefine what constitutes a moment worth logging: A request reaches the service, performs a task, and leaves the service again. This lifecycle is a single, continuous process. Accordingly, it should be logged as exactly one event. The event is not emitted until all the information is available.
Two terms are key here:
Cardinality: Refers to the number of different values a field can take. For example, "Environment" has three possible values (Development, Staging, Production), CustomerId possibly two million. Fields with high cardinality are precisely the ones that can be used to specifically isolate this one request rather than just similar requests. At the same time, these are exactly the fields that are traditionally discouraged from being used in classic log indexes.
Dimensionality: Refers to the number of fields per event. It determines how many different questions can be answered in retrospect. Six fields answer six questions. Sixty fields can also answer combinations that no one had thought of before. That is the real point, because in the event of a malfunction, you never know in advance what information will be needed to solve the problem.
Sixty fields in a single line might sound like a lot at first. However, twenty log lines, each with eight properties, mean more data, in a less organized structure, spread across twenty fragments that would have to be reassembled in an emergency.
Implementing Wide Events in C#
The pattern is a request-scope accumulator: It is populated as the request travels through the layers and is written exactly once at the boundary.
The class is registered as Scoped, so that all layers within a request receive the same instance. The actual logging is handled in a middleware component that covers the entire request process:
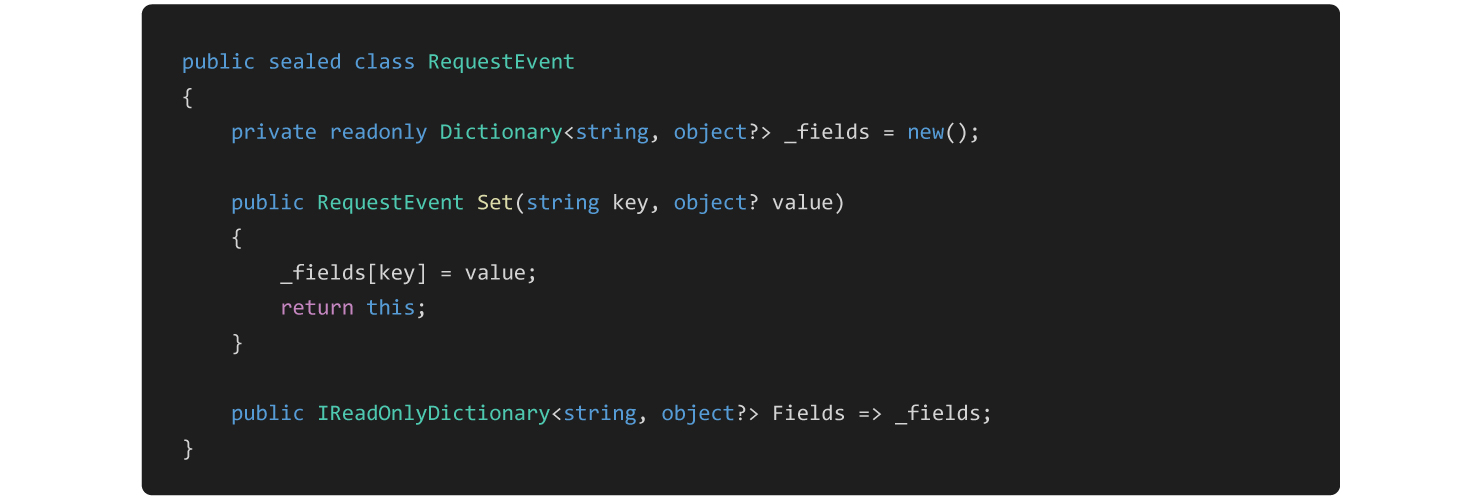
There is only this one distribution point in finally block, which is executed and saves the message regardless of whether the request was successful, failed functionally, or threw an exception.
The services and handlers that execute the actual business logic no longer write logs; instead, they provide context exclusively:
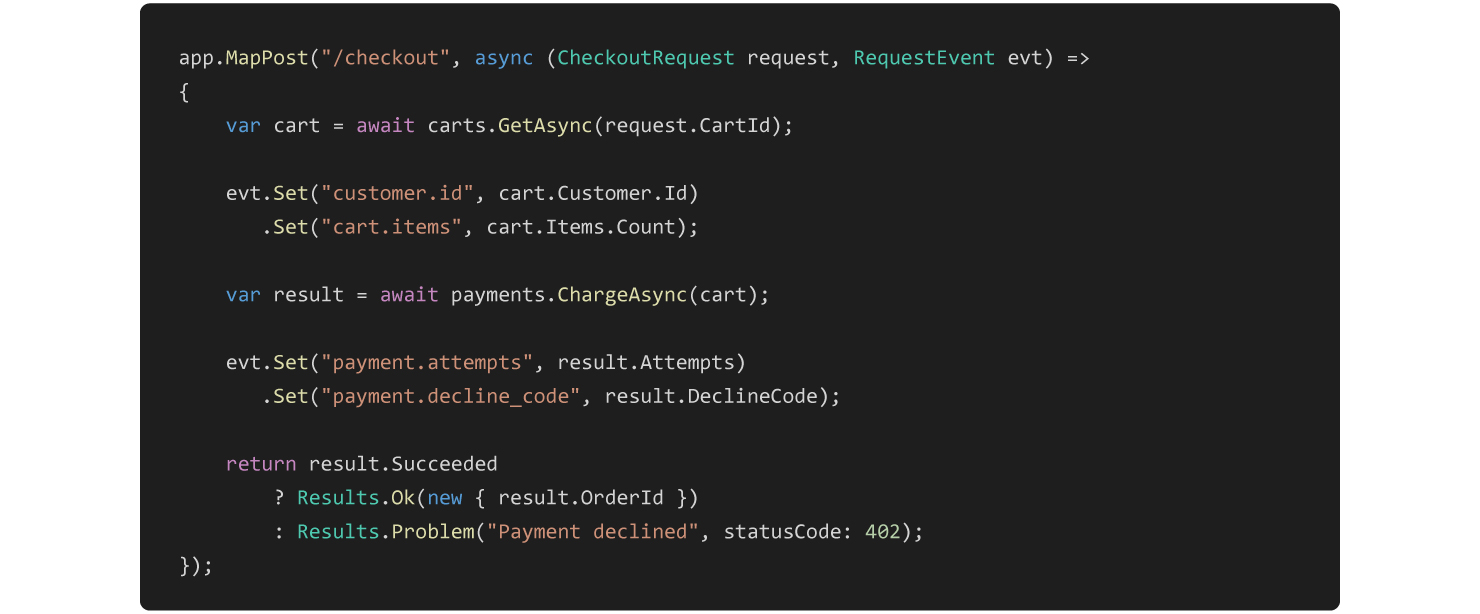
Third-party dependencies can also be added in the same way, such as status codes or response times.
Anyone who has already OpenTelemetry, set the same fields as tags on Activity.Current—in which case the span is the wide event. The key point here is that OpenTelemetry is a transport mechanism and a schema convention. It transports telemetry data but does not determine its content. Auto-instrumentation can be helpful for basic metrics, but it can never provide information about business-relevant processes.
When a Request Isn’t the Right Limit
The previous example implicitly assumes that the business logic is completed with the HTTP response. In many systems—such as distributed microservice architectures—a request, however, merely triggers a longer-running process: A message is placed in a queue, multiple consumers process it sequentially or in parallel, or an external service responds later via a callback. A single event for the original request would explain the start, but not the outcome of the actual operation.
Therefore, the more meaningful unit is not necessarily the request, but rather a completed unit of work. The HTTP endpoint emits an event indicating that the checkout has been accepted and a message has been published. The payment consumer generates its own event for processing this message. A downstream dispatch process does the same. Each event contains the complete context of its local step and is written exactly when its result is determined. Batch processes emit an event for each item processed from the work pool.
To turn these events back into a coherent professional process, the relevant identities must survive every boundary: for example, trace.id for technical correlation, order.id or workflow.id for the business process, as well as message.id for the individual message. This keeps the steps linked without having to artificially combine different lifespans.
This also makes it easier to explain retries and partial task processing. Instead of seeing the same log messages four times in a row, you can evaluate a retry.attemptproperty to gain important insights into the reliability of the logic.
“One event per request” is therefore a useful rule of thumb, but the pattern is more like one wide event per completed work unit. The size of a work unit depends on the application and the implemented processes.
Performance and Costs: Sampling Under Heavy Load
There is also an obvious objection: Sixty fields at ten thousand requests per second result in significant memory costs.
However, the solution is not to collect fewer fields, but simply to store fewer events. The decision should be based on what actually happened. This decision can be made once the request has been fully processed. An example:

The function stores all events with an error field and takes a random sample of five percent from the remaining requests. Additional rules can specifically target slow requests or processes that are particularly relevant to the business. The specific criteria applied and how they are weighted depend on the business requirements and the corresponding business decisions. The only prerequisite is that the necessary information is available in the event.
A note on operating multiple services within a single system: The decision on whether to save or discard a message should be consistent throughout the entire trace. Otherwise, the checkout event will be retained, while the explanatory payment event will not be saved. Passing the decision via HTTP headers can work; however, implementing this logic in a central location leads to better traceability.
How Wide Events Are Making a Difference in Practice
Back to the ticket from Thursday afternoon: You filter by customer number for the time period in question and get four lines: three 402s and one 500. The 500 error line shows that this was the fourth attempt, that the gateway took 8.2 seconds, that the decline code was issuer_unavailable, and that the new pricing flag was active.
This raises a question that couldn't have been asked before: How many customers with this flag have been affected since the last deployment issuer_unavailable? Thirty seconds later, it’s clear whether it’s a support case or an incident.
The real change isn't just that troubleshooting becomes faster. The same database enables both individual case analysis and evaluation across the entire population. That is precisely what distinguishes simple logging from true observability: it allows us to answer questions that the developer hadn’t even considered at the time of implementation.
Do you want to build applications that are observable and maintainable from the start? We support you with cloud-native, AI-enabled software development as well as with modernization of existing legacy applications.


Frequently Asked Questions About Wide Events and Observability
-
What does data sovereignty mean in Microsoft 365?
In short: A Wide Event is a single structured data record per work unit that consolidates the entire context of a process—results, duration, dependencies, as well as customer and business data. It replaces twenty scattered log lines with a single queryable unit.
-
What do wide events have to do with observability?
Observability means understanding the internal state of a system solely through its external outputs. Wide events are the foundation of modern observability (often referred to as Observability 2.0): Thanks to their high dimensionality and cardinality, they allow you to ask the system any questions in the event of a failure—even those that no one thought of during development.
-
When Are Wide Events Worth It for Better Observability?
Whenever the complete context of a transaction is important in the event of a failure—that is, for HTTP requests, background jobs, queue consumers, or batch runs. The higher the load and the more parallel processing takes place, the greater the advantage over scattered individual lines of code.
-
Will Wide Events Replace Structured Logging?
No. Structured logging improves the format of individual log lines, while wide events change the scope of logging. Wide events are based on structured fields and consolidate them into a single event per operation.
-
Why do traditional logging systems discourage high cardinality?
Traditional log and metrics indexes become expensive and slow when they contain many different field values, which is why high cardinality is considered a cost risk in that context. For wide events and true observability, however, high cardinality is the real value: only a field with many possible values (such as a customer ID or order ID) makes it possible to locate exactly one request.
-
Do I absolutely need OpenTelemetry for Wide Events?
No. Wide events work with any log sink that stores structured fields. OpenTelemetry is a convenient option for transport because the fields can be carried as span tags—but this is not a requirement for the concept.
Written by

Fabian Berthold has been working as a .NET developer for over 10 years, during which time he has developed a deep understanding of innovative technologies and their application. He has been with Arvato Systems since 2022, where he uses his passion for technology and his expertise to drive innovative solutions.