How Classic Monitoring Is Becoming Cloud-Ready
Monitoring service based on AWS
The cloud is the enabler for automatically scaling infrastructures
IT can develop much more dynamically thanks to the cloud. It's just that very few companies start from scratch. In most cases, the existing infrastructure has grown over many years. In order to benefit from the advantages of the cloud, existing on-premises processes and cloud-native services must run in an integrated manner. However, keeping track of this often presents companies with a challenge. For example, when it comes to monitoring dynamic services in the cloud and integrating them into an existing IT service management (ITSM) system.
When classic monitoring is no longer sufficient
Classic monitoring cannot adequately reflect the dynamics of cloud IT. This is just one of many challenges: Servers or containers started at short notice should ideally be monitored directly. However, when scaling down, these must not be incorrectly displayed as "not available".
The market offers various solutions for this.
Existing open source solutions and tools
Classic open source applications here are Nagios or Zabbix. Both are well-known and much-used tools in static IT environments. In dynamic cloud environments with DevOps speed, however, they cannot be used meaningfully without extensions.
Modern open source applications such as Sensu and Prometheus are the new trendsetters in monitoring. They can monitor virtual compute resources as well as network or storage. Prometheus is particularly specialized in containers and is the global leader in this area.
SaaS tools such as SysDig, NewRelic Infrastructure and DataDog are specifically designed for use in dynamic cloud environments. They monitor both infrastructure components and vendor platform services. For small environments, the barriers to entry are low, in addition to the cost. However, since the services are paid per monitored unit (e.g., server, DB service, certificate, and others), higher amounts quickly materialize here. This usually makes the services unattractive for larger environments.
Monitoring Service from Arvato Systems based on AWS
The experts at Arvato Systems have taken on this challenge and created an integrated monitoring platform. The self-developed solution is based on AWS platform services, serverless computing and open source software. It combines the advantages of cloud-based infrastructures with Arvato Systems' own ITSM system and thus forms the interface between the old and new IT worlds.

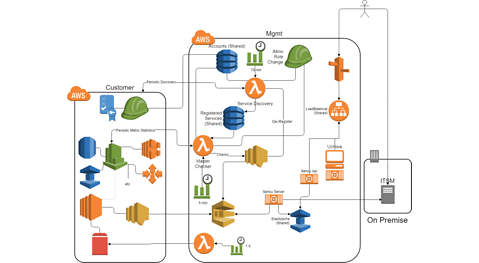
Figure: Rough overview of the architecture of the Monitoring Service.
- The hybrid platform developed by Arvato Systems is based on various tools for collecting metrics and test results. Sensu is installed and configured as an agent on EC2 virtual machines using the Chef configuration management tool. This enables operating system level checks. These include, for example, disk fill level, memory utilization, application error rate, and more.
- For checking AWS resources, AWS CloudWatch is requested via API, evaluated and displayed accordingly in the central dashboard. This was implemented using Serverless Application in AWS Lambda to enable the most cost-efficient and scalable operation.
- The central system provides an overview of the current status of all environments and systems managed by Arvato Systems via the Uchiwa interface. It is connected to Arvato Systems' own ITSM system and thus supports 24/7 operation, in combination with control center and standby.
- Thanks to the Uchiwa interface, maintenance windows can be stored in the different environments. This is used to decide whether a ticket is to be created, what criticality it is to be given and to which service or specialist group it is to be assigned. A direct connection of the central system to messanger services or customer-specific solutions is also possible through client separation.
- In the Customer Account, the results of the Sensu agents are collected via Amazon SNS (Simple Notification Service) and transferred to Amazon SQS (Simple Queue Service) in the Management Account. These are then processed using Sensu and in ElastiCache Uchiwa accesses this data and provides the information. Lambda functions are periodically executed in the Management Account for automatic detection and monitoring of new services or virtual machines.
The Clou - Monitoring for Scalable Cloud Environments
There is no fear of overloading the built system, as this was built entirely with dynamic PaaS services and a dynamic scaling container environment.
The technical details of the Arvato Systems Monitoring Service on AWS are also presented in the "This is my architecture" video. The video is available on the AWS homepage or the AWS YouTube channel.
Written by

Philipp Hellmich has been with Arvato Systems for over 18 years and has more than ten years of cloud experience in AWS and Kubernetes. He holds six AWS certificates, was involved in the AWS partnership early, and today leads the development of scalable cloud infrastructures as Team Lead AWS DevOps.

